Introduction
Receiver Operating Characteristic (ROC) curves are fundamental tools in machine learning, especially when evaluating the performance of classification models. Understanding ROC curves enables data scientists and machine learning practitioners to assess how well their models distinguish between classes. This comprehensive guide delves into the basics of ROC curves, their applications, and how to interpret them effectively in machine learning.
| Outline | Sub-Topics |
|---|---|
| Basics of ROC Curves | Introduction to ROC Curves |
| Historical Context of ROC Curves | |
| Importance of ROC Curves in Machine Learning | |
| Understanding the Components of ROC Curves | True Positive Rate (Sensitivity) |
| False Positive Rate (1-Specificity) | |
| Thresholds and Decision Points | |
| Plotting ROC Curves | Steps to Plot ROC Curves |
| Example of Plotting ROC Curves | |
| Interpreting ROC Curves | Understanding the Diagonal Line |
| Significance of the Area Under the Curve (AUC) | |
| ROC Curves in Imbalanced Datasets | |
| Applications of ROC Curves in Machine Learning | Model Comparison Using ROC Curves |
| Selecting the Optimal Threshold | |
| ROC Curves in Medical Diagnostics | |
| Advantages of Using ROC Curves | Advantages in Model Evaluation |
| Benefits Over Other Evaluation Metrics | |
| Challenges and Limitations of ROC Curves | Limitations in Multi-Class Classification |
| Impact of Data Imbalance | |
| Enhancing Model Performance Using ROC Curves | Improving Sensitivity and Specificity |
| ROC Curves in Hyperparameter Tuning | |
| ROC Curves in Real-World Scenarios | ROC Curves in Finance and Fraud Detection |
| Applications in Marketing and Customer Segmentation | |
| Tools and Libraries for ROC Curves | Python Libraries for ROC Curves |
| Software Tools for ROC Analysis | |
| Case Studies and Practical Examples | Case Study in Healthcare Analytics |
| Practical Example in E-commerce | |
| FAQs | What is a ROC Curve? |
| How to interpret the AUC of a ROC Curve? | |
| What are common pitfalls in using ROC Curves? | |
| Conclusion | Summary of Key Points |
Basics of ROC Curves
Introduction to ROC Curves
A Receiver Operating Characteristic (ROC) curve is a graphical representation used to illustrate the diagnostic ability of a binary classifier system as its discrimination threshold is varied. ROC curves are particularly useful in machine learning for visualizing and evaluating the performance of models.
Historical Context of ROC Curves
The concept of ROC curves originated from signal detection theory during World War II, where it was used to discern between signal and noise. Today, ROC curves are extensively applied in various fields such as machine learning, medical diagnostics, and information retrieval.
Importance of ROC Curves in Machine Learning
Receiver Operating Characteristic curves play a crucial role in model evaluation, offering a robust measure of a model’s ability to distinguish between positive and negative classes. This is especially important in fields like healthcare and finance, where making accurate predictions is critical.
Understanding the Components of ROC Curves
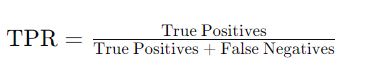
True Positive Rate (Sensitivity)
The True Positive Rate (TPR), also known as Sensitivity or Recall, measures the proportion of actual positives correctly identified by the model. It is calculated as:
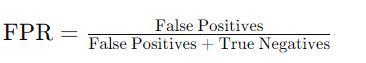
False Positive Rate (1-Specificity)
The False Positive Rate (FPR) represents the proportion of actual negatives incorrectly identified as positives. It is given by:
Thresholds and Decision Points
A threshold determines the point at which the classifier decides between classes. Varying the threshold affects the TPR and FPR, allowing the ROC curve to demonstrate the trade-off between these rates at different threshold settings.
Plotting ROC Curves
Steps to Plot ROC Curves
- Compute the predicted probabilities for the positive class.
- Set a series of thresholds ranging from 0 to 1.
- Calculate TPR and FPR at each threshold.
- Plot the ROC curve by graphing TPR versus FPR.
Example of Plotting ROC Curves
Consider a model predicting the likelihood of disease. By plotting TPR against FPR at various threshold levels, we create the ROC curve, showcasing the model’s diagnostic ability.
Interpreting ROC Curves
Understanding the Diagonal Line
A diagonal line in an ROC curve plot indicates a model with no discrimination ability, equivalent to random guessing. The closer the ROC curve is to the top left corner, the better the model’s performance.
Significance of the Area Under the Curve (AUC)
The Area Under the ROC Curve (AUC) quantifies the overall ability of the model to discriminate between positive and negative classes. A higher AUC represents better model performance.
ROC Curves in Imbalanced Datasets
In datasets with class imbalance, ROC curves may not fully reflect the model’s performance. Precision-Recall curves can be more informative in such scenarios.
Applications of ROC Curves in Machine Learning
Model Comparison Using ROC Curves
Receiver Operating Characteristic curves allow for the comparison of multiple models, aiding in the selection of the best-performing model based on its ability to distinguish between classes.
Selecting the Optimal Threshold
Determining the optimal threshold is crucial for balancing sensitivity and specificity, particularly in applications where the cost of false positives and false negatives varies.
ROC Curves in Medical Diagnostics
In healthcare, ROC curves are used to evaluate diagnostic tests, helping to identify the most effective tests for detecting diseases.
Advantages of Using ROC Curves
Advantages in Model Evaluation
ROC curves provide a comprehensive evaluation metric that considers all possible classification thresholds, offering a nuanced view of model performance.
Benefits Over Other Evaluation Metrics
ROC curves are advantageous over metrics like accuracy, particularly in situations where class distributions are imbalanced, as they provide a more balanced assessment.
Challenges and Limitations of ROC Curves
Limitations in Multi-Class Classification
ROC curves are primarily designed for binary classification. Extending them to multi-class problems requires techniques like One-vs-Rest, which may complicate interpretation.
Impact of Data Imbalance
In highly imbalanced datasets, ROC curves may present an overly optimistic view of a model’s performance. Alternative metrics like Precision-Recall curves can offer more insight.
Enhancing Model Performance Using ROC Curves
Improving Sensitivity and Specificity
By analyzing the ROC curve, practitioners can adjust their models to improve sensitivity and specificity, ensuring better overall performance.
ROC Curves in Hyperparameter Tuning
Receiver Operating Characteristic curves are instrumental in hyperparameter tuning, helping to identify the parameter settings that yield the best balance between TPR and FPR.
ROC Curves in Real-World Scenarios
ROC Curves in Finance and Fraud Detection
In the financial industry, ROC curves help in detecting fraudulent transactions by evaluating the performance of fraud detection models.
Applications in Marketing and Customer Segmentation
ROC curves are used in marketing to assess the effectiveness of customer segmentation models, ensuring targeted marketing strategies are accurately implemented.
Tools and Libraries for ROC Curves
Python Libraries for ROC Curves
Python offers several libraries for ROC analysis, including Scikit-learn, which provides functions to compute and plot ROC curves.
Software Tools for ROC Analysis
Software tools like R and MATLAB also offer robust functionalities for ROC analysis, catering to the needs of data scientists and researchers.
Case Studies and Practical Examples
Case Study in Healthcare Analytics
A case study in healthcare analytics demonstrates the use of ROC curves to evaluate predictive models for patient outcomes, highlighting their practical significance.
Practical Example in E-commerce
In e-commerce, ROC curves are used to assess recommendation systems, ensuring that the models effectively identify products that interest users.

FAQs
What is a ROC Curve?
A ROC curve is a graphical representation that illustrates the diagnostic ability of a binary classifier as its discrimination threshold is varied.
How to interpret the AUC of a ROC Curve?
The AUC represents the overall ability of the model to discriminate between positive and negative classes, with higher values indicating better performance.
What are common pitfalls in using ROC Curves?
Common pitfalls include misinterpretation in the context of imbalanced datasets and overlooking the importance of the optimal threshold selection.
Why are ROC curves important in machine learning?
ROC curves are crucial for evaluating the performance of classification models, helping practitioners understand how well their models distinguish between classes.
How do ROC curves handle imbalanced datasets?
ROC curves can be misleading in imbalanced datasets, where metrics like Precision-Recall curves might offer a more accurate assessment.
What tools can be used to plot ROC curves?
Python libraries such as Scikit-learn, and software tools like R and MATLAB, provide robust functionalities for plotting and analyzing ROC curves.
Conclusion
ROC curves are indispensable tools in machine learning, offering deep insights into the performance of classification models. By understanding their components, interpreting their plots, and applying them in various domains, practitioners can significantly enhance their model evaluation processes. ROC curves not only aid in comparing models but also in selecting optimal thresholds, ultimately leading to more accurate and reliable predictions.